RegattaDB TPC-C Benchmark: 750,000+ TPS

Jim Walker
Chief Product Officer
See how leading teams deploy agents at scale in our upcoming webinar — Register here.
Jim Walker
Chief Product Officer
This post documents a TPC-C benchmark for RegattaDB at 1.5 million warehouses across 50 GCP nodes, sustaining over 750,000 transactions per second at 98% tpmC efficiency. We provide full visibility into CPU utilization, memory pressure, NVMe disk I/O, and per-transaction latency percentiles throughout the workload. The goal is to show not just what the numbers are, but what they mean for teams evaluating distributed OLTP databases at extreme concurrency and scale.
We ran this benchmark in isolation. RegattaDB can do this while simultaneously running analytical queries which is something we demonstrate separately. But first, the transactional numbers.
Key results at a glance:
What Is This Benchmark and Why Does It Matter?
Performance numbers are easy to publish and hard to interpret. We ran this benchmark to answer a practical question: how does RegattaDB behave at massive scale under sustained, realistic transactional load over time and under contention? We wanted to push our TPC-C testing to the limit, but we will also publish a more “normal” workload (200k warehouses) in the next few weeks.
What is TPC-C?
TPC-C is a transactional benchmark designed to stress concurrency, coordination, durability, and latency under sustained transactional (OLTP) load. While many published results focus on peak throughput, fewer demonstrate how systems behave when pushed to extreme scale with realistic concurrency and storage pressure.
Test Configuration: 1.5 Million TPC-C Warehouses at Scale
We evaluated RegattaDB using a distributed deployment designed to reflect production usage rather than an idealized lab setup. The goal was not to produce the highest possible score, but to observe stable behavior under realistic conditions. In TPC-C, the number of warehouses is the primary scale factor. Increasing warehouses grows:
For this run, the database is pre-populated with 1.5 million warehouses. At this scale, the total data footprint works out to just over 11 MB per warehouse. While we executed smaller configurations with full population at maximum capacity, for this 50-node cluster, a lighter population method was employed to reduce costs while fully maintaining the transaction load rate and ensuring representative results.
Cluster Specification: 50-Node GCP Deployment with Local NVMe SSDs
In total, the database spans 150 local NVMe SSDs, all actively participating in the workload.
TPC-C Throughput Results: 750,000+ TPS at 98% tpmC Efficiency
An internal RegattaDB monitoring tool shows the system sustaining over 750,000 transactions per second during peak execution. This level of load is where many systems encounter contention collapse, coordination bottlenecks, or tail-latency spikes. In this run, RegattaDB maintains stable execution while continuing to process transactional bursts at scale.
Throughout the run, the monitoring dashboard confirms that the 50-node cluster:
What is tpmC?
tpmC is a very specific and significant “magic number” in the TPC-C benchmark. It represents a theoretical maximum throughput allowed per “warehouse” in the test. If a database produces 12.8 tpmC per warehouse, it mean the database is running at ~99% efficiency. You are getting the absolute maximum performance possible out of your data setup.
We measured resource utilization across the cluster during the run and peak vCPU utilization per node is 42 (out of the configured 44 vCPUs). TPC-C workloads are inherently cyclical. Terminals submit transactions, wait for completion, and then pause for mandated think time. This pattern is visible across hTOP, showing CPU utilization rising during transaction bursts and dropping during think time intervals and nmon, capturing how RegattaDB absorbs sharp load spikes without instability.
The system is not artificially smoothed or rate-limited; it processes the natural concurrency waves produced by 1.5 million active warehouses. Despite hundreds of gigabytes of memory per node, the working set at this scale exceeds RAM capacity. As a result, the workload drives sustained, high-volume disk reads and writes per node, reflecting real operational pressure rather than transient bursts or synthetic throttling.
The I/O profile closely mirrors the transactional cycles of TPC-C, indicating that storage is meaningfully exercised rather than bypassed through aggressive caching.
Transaction Latency Percentiles (p50–p99) Across All TPC-C Transaction Types
Finally, we measured p50, p90, p95 and p99 latencies for each transaction type. TPC-C is fundamentally a concurrency and tail-behavior test, not just a throughput test and its main measure tpmC can hide instability. Percentile latencies expose behavior under real contention, and each level is important to consider for each of the transacting tables. (Note: further improvements are in progress always.)
| p50(ms) | p90(ms) | p95(ms) | p99(ms) | AVG(ms) | |
| New-Order | 39.4 | 123 | 325 | 640 | 66.6 |
| Payment | 19.8 | 30.8 | 38.4 | 47.5 | 21.1 |
| Order-Status | 19.8 | 30.2 | 30.2 | 40.2 | 17.0 |
| Delivery | 213 | 986 | 988 | 992 | 458 |
| Stock-Level | 29.6 | 40.2 | 41.1 | 53.3 | 25.3 |
Watch the Full Benchmark Run on YouTube
We capture the run on a video that highlights some of these key points and uses a little magic to fast forward through various waits. You can view it on our YouTube channel.
What These TPC-C Results Actually Mean
This run demonstrates RegattaDB executing a classic OLTP benchmark at a scale rarely shown publicly. This does not take into consideration that RegattaDB could handle analytical queries while these transactions are being committed.
The report provides full visibility into system behavior under load. Rather than optimizing for a narrow peak result, the system sustains transactional execution across millions of warehouses, hundreds of thousands of concurrent transactions, and active disk I/O. Also, TPC-C results are often misread when reduced to a single throughput number. A few clarifications are important:
OLTP and OLAP Simultaneously: What RegattaDB Can Do Beyond This Benchmark
These results characterize transactional performance under extreme concurrency. They do not measure analytical queries or mixed OLTP/OLAP workloads that RegattaDB can also deliver. In fact, we can execute massive analytical workloads at the same time as we sustain continuous transaction. We recently published a post that demonstrates this using a JOIN across two 10 billion row tables while we sustain 50,000 UPDATES per second.
Why We Publish CPU, I/O, and Latency: Not Just tpmC
Also, we feel transparency matters so we not only publish the high level tpmC number, but also add CPU, I/O, concurrency and latency metrics, which allows you to better reason about system behavior rather than relying on aggregate scores alone.
For teams evaluating databases for high-concurrency, large-scale transactional systems, especially those supporting modern microservices or agent-driven workloads, this benchmark provides a concrete reference point grounded in observable system behavior.
Soon, we will publish a benchmark for a more mundane 200K warehouse run, so stay tuned as that will drop soon. Also, if you are running a benchmark of your own or evaluating databases for your application, we’d be happy to connect to see if RegattaDB fits your architecture. Contact us at info@regatta.dev
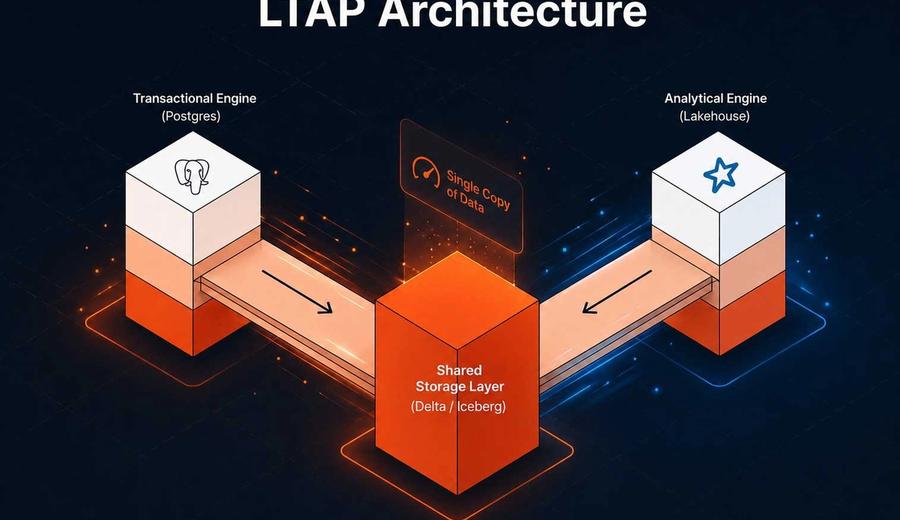
A few weeks ago we published an analysis of Databricks LTAP and the architectural questions it left open. One question in particular...
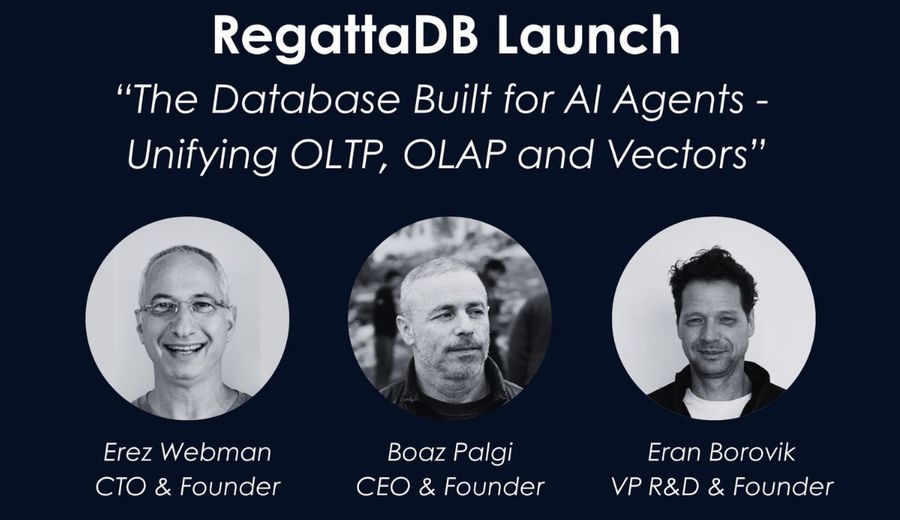
RegattaDB Launches as the Database Built for AI Agents — Unifying OLTP, OLAP, and Vectors RegattaDB unifies transactions, analytics,...
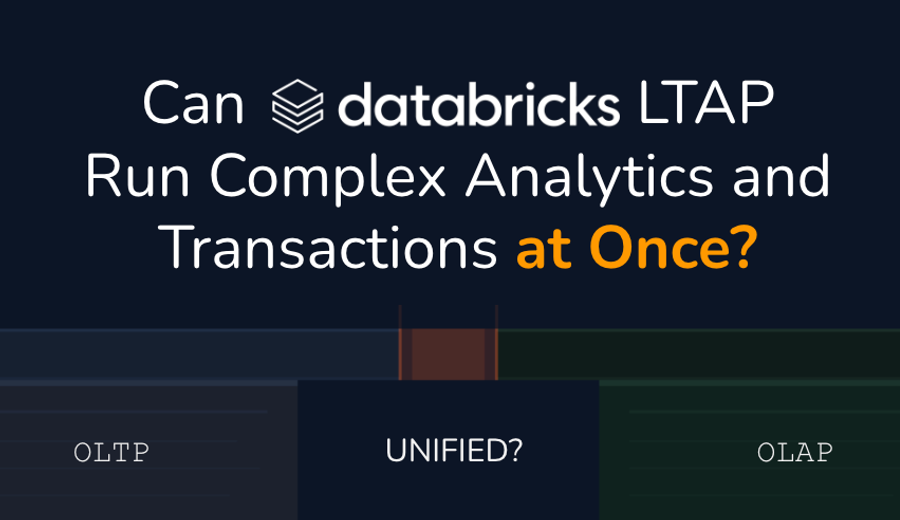
Databricks made a significant announcement at Data + AI Summit this week. LTAP, or Lake Transactional/Analytical Processing, is their answer to a problem the...